多層パーセプトロンをPythonで実装してみた-2-
前回(↓)の続き。
多層パーセプトロン各層の実装ができたので実際に動かしてみる。
パーセプトロンの数や層の構成は↓を参考にした。
googlecloudplatform-japan.blogspot.jp
簡単な分類
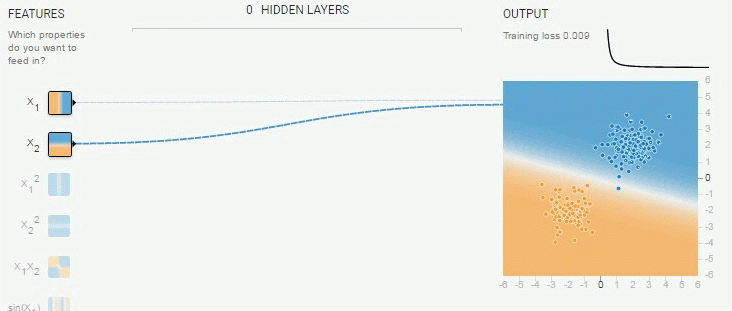
直線分類
まず↓をやってみる。
実装は↓
# -*- coding: utf-8 -*-

import numpy as np
import matplotlib.pyplot as plt
import random as random
from sklearn.datasets import make_blobs
from sklearn.datasets import make_circles

import NNLayer as nn

def linearlySeparable():

  #学習数、ループ回数
  iteration_num = 10
  sample_num = 100

  #学習結果表示グラフ設定
  x1_array = np.arange(-8,8,0.4)
  x2_array = np.arange(8,-8,-0.4)
  pos_x1,pos_x2 = np.meshgrid(x1_array,x2_array)
  val_y = np.identity(40)

  shuffle_list = list(range(sample_num))
  match_list = []
  cnt_list = []
  inputLayerY = np.zeros(2)

  #NN作成
  iLayer = nn.inputLayer(2,2,1)
  oLayer = nn.outputLayer(2,1,1,0.03)

  #テストデータ作成
  centers = [(3,3),(-3,-3)]
  #centers = [(-3,-3),(3,3)]
  #centers = [(0,-3),(0,3)]
  #centers = [(-3,0),(3,0)]
  x_exp,y_exp = make_blobs(n_samples= sample_num,centers=centers,random_state=42,cluster_std=1.5)

  #yの値を[0,1]から[-1,1]にする
  y_exp = [x if x != 0 else -1 for x in y_exp]

  #初期値で一度グラフ描画
  plt.ion()

  for index_x1 in range(len(x1_array)):
    for index_x2 in range(len(x2_array)):

      #X1
      inputLayerY[0] = x1_array[index_x1]
      #X2
      inputLayerY[1] = x2_array[index_x2]

      iLayer.foward(inputLayerY)
      oLayer.foward(iLayer.getY())

      val_y[index_x1][index_x2] = oLayer.getY()
  #グラフ表示
  plt.clf()
  plt.subplot(2,1,1)
  plt.xlim(-8,8)
  plt.ylim(-8,8)
  plt.pcolor(pos_x1,pos_x2,val_y)
  plt.colorbar()
  plt.scatter(x_exp[:,0],x_exp[:,1],c=y_exp,s=80)
  plt.subplot(2,1,2)
  plt.plot(cnt_list,match_list)
  plt.pause(0.05)


  for i in range(iteration_num):
    match = 0
    #学習フェーズ
    for j in shuffle_list:

      #X1
      inputLayerY[0] = x_exp[j][0]
      #X2
      inputLayerY[1] = x_exp[j][1]

      iLayer.foward(inputLayerY)
      oLayer.foward(iLayer.getY())

      if (((y_exp[j] < 0) & (oLayer.getY() < 0)) |
          ((y_exp[j] > 0) & (oLayer.getY() > 0))):
        match += 1

      oLayer.backprop(y_exp[j])
      oLayer.updateWeight()

    #次の学習時に順番をシャッフルする
    random.shuffle(shuffle_list)

    match_list.append(match/sample_num)
    cnt_list.append(i)
    #学習結果(ヒートマップ)
    for index_x1 in range(len(x1_array)):
      for index_x2 in range(len(x2_array)):

        #X1
        inputLayerY[0] = x1_array[index_x1]
        #X2
        inputLayerY[1] = x2_array[index_x2]

        iLayer.foward(inputLayerY)
        oLayer.foward(iLayer.getY())

        val_y[index_x2][index_x1] = oLayer.getY()

    #結果グラフ表示
    plt.clf()
    plt.subplot(2,1,1)
    plt.xlim(-8,8)
    plt.ylim(-8,8)
    plt.pcolor(pos_x1,pos_x2,val_y)
    plt.colorbar()
    plt.scatter(x_exp[:,0],x_exp[:,1],c=y_exp,s=80)
    plt.subplot(2,1,2)
    plt.plot(cnt_list,match_list)
    plt.pause(0.05)

  while True:
    plt.pause(0.05)

if __name__ == '__main__':
  linearlySeparable()
オンライン学習、学習率は0.03固定で実行
実行結果は↓
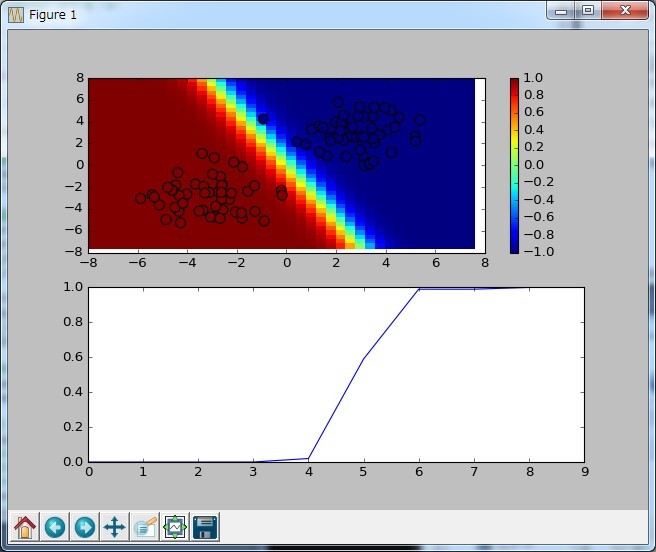
悪いときでも100データ×10回学習すればほぼ100パーセントになった。
円形分類
次は隠れ層を追加する。
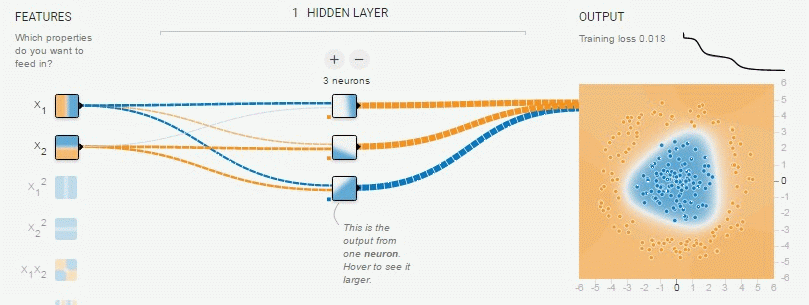
実装は直線分類とほぼ同じ。
異なるのはパーセプトロンの構成とループ数とテストデータ作成
テストデータ
  #テストデータ作成
  x_exp,y_exp = make_circles(n_samples = sample_num,factor=0.3,noise=0.05)

  x_exp *= 3

  #yの値を[0,1]から[-1,1]にする
  y_exp = [x if x != 0 else -1 for x in y_exp]
3倍しているのはそのままだと円が小さかったので適当に大きくしている。
パーセプトロン構成
  #NN作成
  iLayer  = nn.inputLayer(2,4,4)
  h0Layer = nn.hiddenLayer(2,4,1,0.03,True)
  oLayer  = nn.outputLayer(4,1,1,0.03)
結果は↓
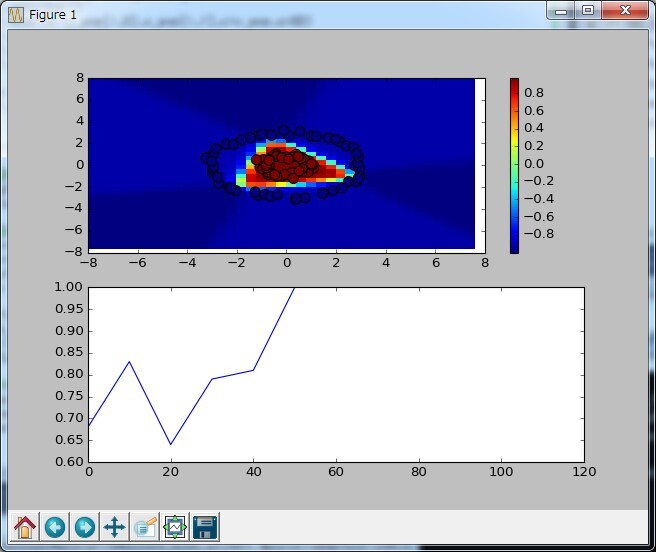
100データ×50回学習すればほぼ100パーセントになった。
ただ、初期値がランダムの為か、たまに↓みたいに収束しない時がある。

渦巻き分類
もっと隠れ層を追加する。
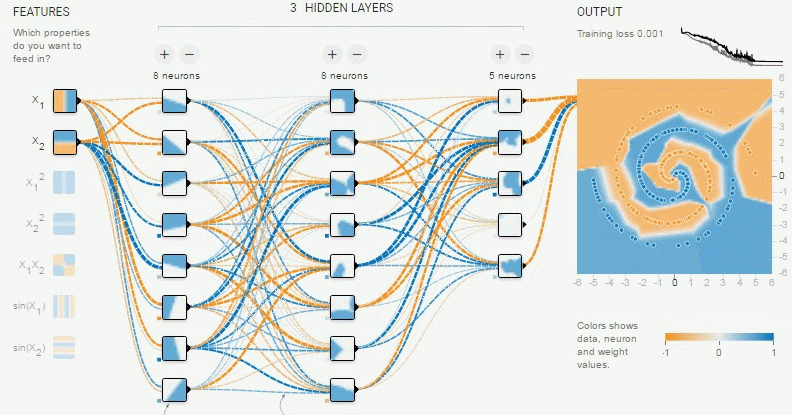
sklearnに渦巻きのデータセットがなさそうだったので数式を実装した。
テストデータ
  x_exp = np.zeros((sample_num,2))
  y_exp = np.zeros(sample_num)
  for i in range (sample_num):
    theta = random.uniform(-3*math.pi,3*math.pi)
    if (theta > 0):
      x_exp[i][0] = 0.5*math.cos(theta)*theta
      x_exp[i][1] = 0.5*math.sin(theta)*theta
      y_exp[i] = 0.5
    else:
      x_exp[i][0] = 0.5*math.cos(theta)*theta
      x_exp[i][1] = 0.5*math.sin(theta)*-theta
      y_exp[i] = -0.5
テストデータは[-1,1]ではなく[-0.5,0.5]にしている。
これは[-1,1]でなかなか収束しない時に↓を見たら、
tanhの時は出力を-0.65848~0.6584にすると良いと
書いてあったのでそうすると収束率がかなり改善した。
パーセプトロン構成
  #NN作成
  iLayer  = nn.inputLayer(2,8,8)
  h0Layer = nn.hiddenLayer(2,8,8,0.03,True)
  h1Layer = nn.hiddenLayer(8,8,5,0.03,True)
  h2Layer = nn.hiddenLayer(8,5,1,0.03,True)
  oLayer  = nn.outputLayer(5,1,1,0.03)
結果は↓

データ数が100だと渦巻きがかなりまばらになったので
これはデータ数を200にしている。
200データ×300回くらいでほぼ100パーセントになる。
長くなったので今回はここまで
次回こそはMINSTやるよ!